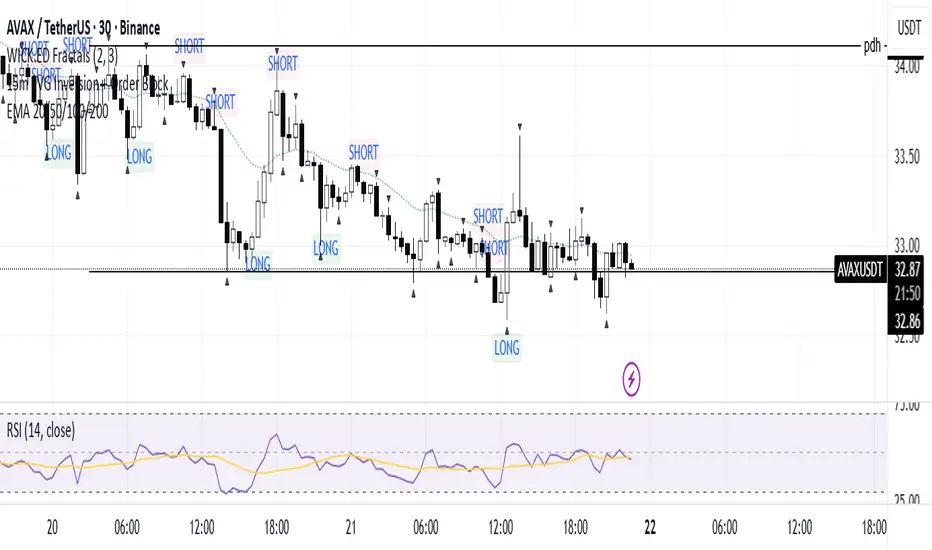
SMC Liquidity & Order Blocks🔹 1. Moving Averages for Trend Confirmation
Uses Exponential Moving Averages (EMA) to determine trend direction.
9-period EMA (blue) and 15-period EMA (red) are plotted.
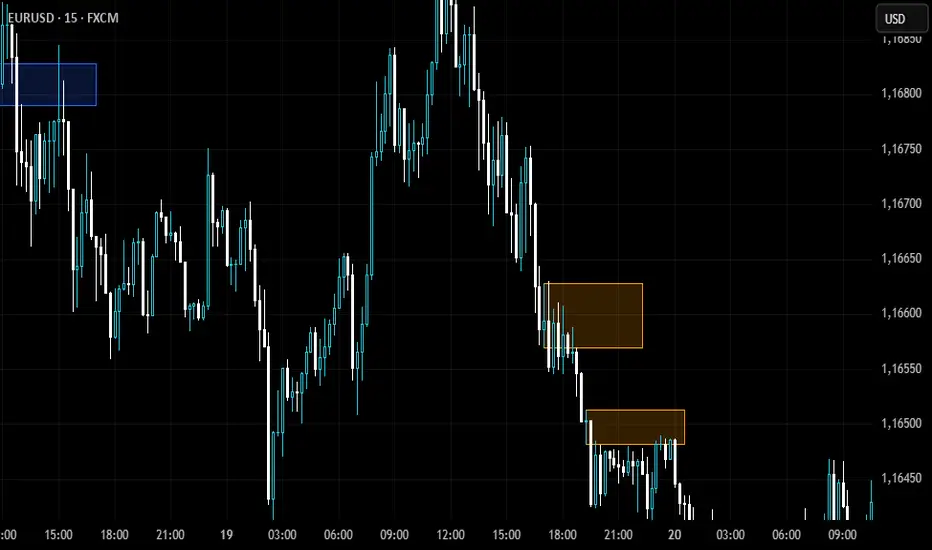
🔹 2. Liquidity Zones (Swing Highs & Lows)
Identifies liquidity zones where price is likely to react.
Buy-Side Liquidity: Highest high over 20 periods (Green line).
Sell-Side Liquidity: Lowest low over 20 periods (Red line).
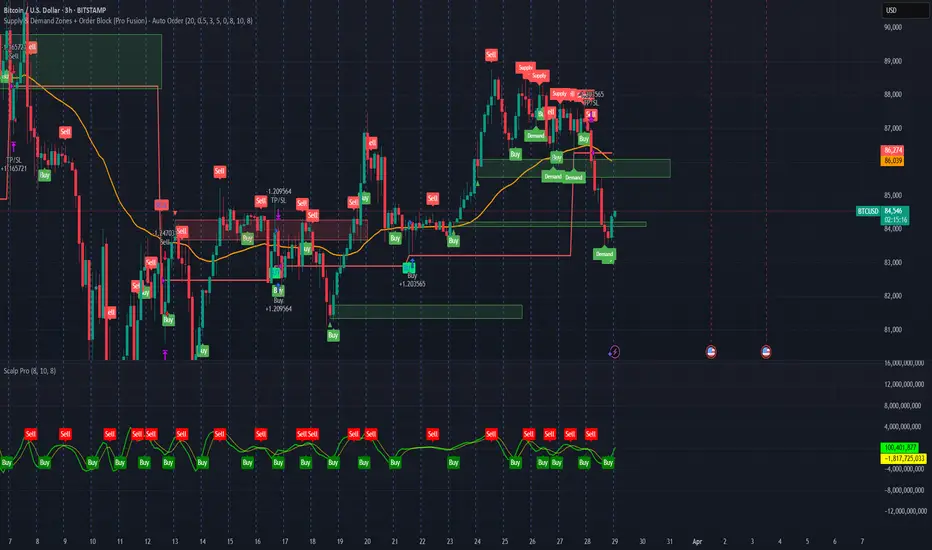
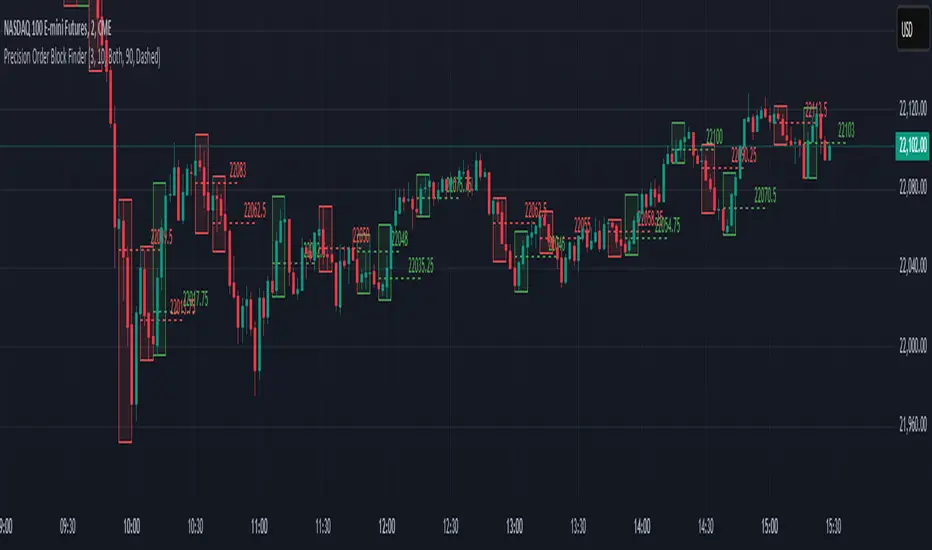
🔹 3. Order Block Detection
Detects bullish and bearish order blocks (key price zones of institutional activity).
Bullish Order Block (OB): Formed when the highest close over 5 bars exceeds the highest high.
Bearish Order Block (OB): Formed when the lowest close over 5 bars is lower than the lowest low.
Plotted using green (up-triangle) for bullish OB and red (down-triangle) for bearish OB.
🔹 4. Fair Value Gaps (FVG)
Detects price inefficiencies (gaps between candles).
FVG Up: When a candle's high is lower than a candle two bars ahead.
FVG Down: When a candle's low is higher than a candle two bars ahead.
Plotted using blue circles (FVG Up) and orange circles (FVG Down).
Indicador Pine Script®